
It can be really handy to be able to view the program memory data bytes of an Intel hex file when developing and debugging boot loaders. Your IDE probably has a program memory view which does this, but often its more helpful to use a third party piece of software which shows you a nice and simple memory view and addressed correctly as the values will be burnt into a microcontroller.
The best application we've found for this is the SEGGER "J-Link software" which is actually intended for use with their programmers, but which can be downloaded for free (there is an option to not have a serial number and you then just need to confirm you are not going to use it with a non SEGGER programmer). Download "J-Link software & documentation pack for Windows" from here.
Install it and then run:
C:\Program Files (x86)\SEGGER\JLinkARM_V480e\JFlashARM.exe
Select 'create a new project' and press "Start J-Flash".
Now use Menu > File > Open data file and open your .hex file. You'll now see a program memory dump:
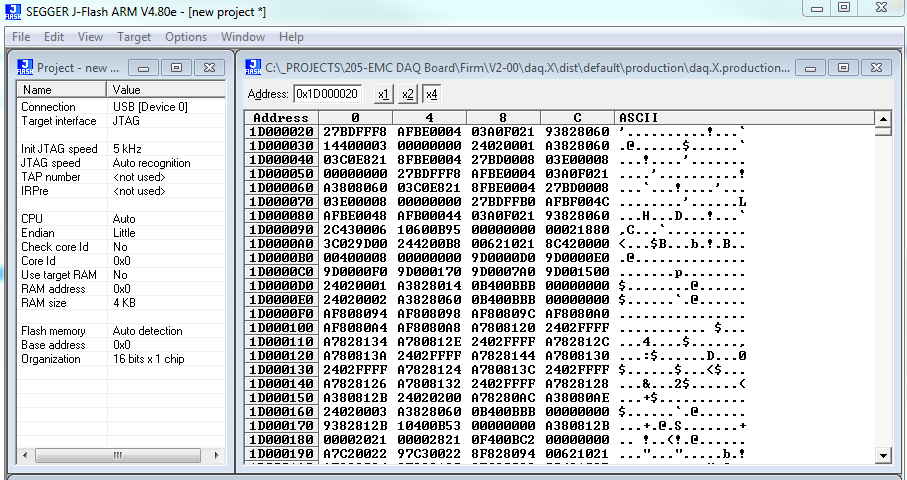
The byte ordering of each 2 or 4 bytes may be different compared to your IDE due to using a different endian but otherwise you should see the program memory values at the addresses they will be written to in your chip.